Friday, 21 October 2016

[5] Tweeting the debate

I've been meaning to post an update for a while, and here is one! I was attending some meetups recently, and decided to do some Twitter data-scraping and analysis. It is all really easy to do - you just sign up for a Twitter developer account, get your API keys, and voila! And what better subject to analyse than US politics... .

Wrong!
As I'm mostly a python guy, I have used the amazingly simple twitter library for connecting to the streaming API. This API outputs a sample of what is being tweeted currently (so no messing with history etc.). It lets you filter by content, so I left a machine running for 40 hours (I also gave it an upper limit of 500GB in case there were a LOT of tweets), searching for tweets with 'debate' (which includes @debate and #debate, though not #DebateNight, and is case-insensitive). I started the data collection the morning (9:45 LA time on October 18th) the day before the debate, and finished it the night after (1:45am on October 20th).

The raw data file ended up being about 12.5GB, or just over 2M tweets, so it still fits into the 'medium data' category (i.e. a number-crunching server that is 4 years old can comfortably fit it in memory). I was hoping to use tools like Spark, and maybe I will try to convert my code into that, but there was no need. You can check out (!) my code here.

What can we do with twitter data? NLTK (Natural Language ToolKit) now has a TweetTokenizer class which can tokenise hashtags, @ mentions, emoji and unicode pretty well (though in English mostly). Then we can count frequent terms, and for example generate these word clouds (using wordcloud), for most frequent words following 'trump' or 'clinton':

Guess which one is which.

A slightly fancier thing would be to perform sentiment analysis on the tweets. I initially stumbled upon this Marco Bonzanini's series of posts about twitter analytics, but quick testing showed that I can't seem to find a good seed dictionary for calculating sentiment. After some searching I found this tool for visualising sentiment of tweets by Christopher G. Healey and R. Siddarth Shankar (from North Carolina uni, how fitting), who in turn use sentiment data gathered on MTurk and presented in this paper (available to download).

What I thought was quite smart is the way Healey et al. average sentiment. The database of sentiment mentioned above contains a mean and standard deviation of valence (positive/negative affect), estimated from many measurements. They take both of these and then compute the normal distribution pdf for the valence being exactly the mean, giving a measure of certainty about valence for each word. This is then used as a weight in averaging the sentiment for the whole tweet.
I only analysed sentiment for tweets with >= 2 words in the database, which excluded ~200k tweets (10%) from analysis.

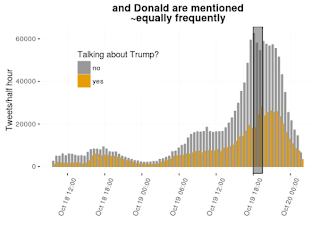
We can see that:
Both of candidates are mentioned about equally frequently during the debate (grey highlight on the right), though Donald has a few more mentions in the night (twitter wars?)
The spike in mentions of candidates seems to be during the debate, though peak mention of both at the same time is a few hours after (comparisons?).
The sentiment of tweets which mention candidates is lower (more 'angry'/'bad'/'racist') than in tweets not mentioning them (note: line is smooth curve fit from ggplot2, using Generalized Additive Model):

Not sure if the rise in sentiment for tweets mentioning Trump is a blip, or maybe it's because he lied only a tiny bit that day?
However it seems that the more people mention any candidate, the worse they feel about them. Even more so if they mention more candidates:
But hey, I can see some hombres on the horizon!
And they are bad! Tremendously bad!

Comments? Leave a comment, check out my source code, give me a shout!

Friday, 8 May 2015

[4] FPTP bias - who's gained and lost the most in GE2015 due to FPTP?

The First-Past-The-Post method (as currently used e.g. in the UK parliamentary elections) has been heavily criticised (a booka very accessible video from CGP Grey), and understandably so, as it creates various problems with tactical voting, and the views of people not being accurately represented. There is a society which campaigns for electoral reform in the UK.

But let's look at the data - which party has gained / lost the most due to FPTP vs. proportional representation in the 2015 General Elections in the UK? What follows is my quick-and-dirty analysis.

[download the data and code]

The method I used is simple - I first calculated the proportion of seats each party gained in the last election. Then I subtracted from it the party's share of votes. To make the data comparable across parties, I divided that number by the share of votes.

UKIP is the biggest loser here, getting just one Commons seat with a 12.7% vote share (~98.8% loss). Democratic Unionist Party (NI) gained more than twice as many seats as its vote share would suggest (~105.1% gain).

There is no obvious relation between the vote share (or seats share) and how much the party gains or loses, so no obvious advantage to small / large parties. However, small regional parties (vide: SNP victory this election) seem to benefit the most.

Still, the number of votes cast seems to be a good predictor of the number of seats.
Unless you are UKIP. We don't like UKIP.

Monday, 10 November 2014

There is a house...

There is a church in Reykjavík which is shaped like a (slightly choppy) approximation of the logistic distribution...
I said approximation, ok?

Thursday, 9 October 2014

[2] #Bellogate

So, we had this happen to UCL e-mails [BBC Link]:

That landed me with (ca.) 3167 e-mails (which I managed to redirect to my spam folder). It started with somebody sending an e-mail from (supposedly) '[email protected]' to '[email protected]', saying 'bello!'. Then, when people started replying to all and realising that anything can get through, the situation spiralled out of control.

Now, I've downloaded the e-mails in Python (this blog post was helpful), and started crunching some numbers.

And yes, they came in large numbers. Over time it picked up, then died slightly after midnight, picked up a bit in the morning (when the problem was fixed by UCL's IT):

Most of the peak around 11pm was due to ucl e-mail addresses sending most e-mails:
Proportion of addresses '@ucl.ac.uk' which sent the e-mail, by the time sent.

It started with most of the e-mails having 'bello' in the title, but soon I had to block all messages sent to all-students, because filtering by title stopped making sense:
Proportion of e-mails with 'bello' in 'Subject' field
Now I'm trying to connect the data in a graph... Who knows, maybe I'll end up doing some Enron-style discovery?

Tuesday, 9 September 2014

Life hacking using gas consumption data

So my flat is in a split terraced house, and somehow both gas meters ended in the neighbours flat (I have the dubious pleasure of having both electricity meters). I'm moving out soon, so I need to submit the final readings to the gas company, but my neighbours are moving out tomorrow, so I won't be able to just pop in to check the readings. The landlord will check the meters anyway, so it's not a big deal, but hey, why should I trust him?
Fear not, for, as a geek, I begot a spreadsheet, in which collected are all figures detailing my hydrocarbon usage, at least in the gaseous phase! So I can trust my own math instead of the landlord! Cue plot:
Hello, Mr. Putin!
You can see quite clearly when the winter started getting cold, when I was away for Christmas, or when I just got lazy and have not taken readings as often. I hear that the police uses electricity consumption to locate weed plantations. Does the BBC use gas consumption to find people for the Great British Bake Off?
Anyway, assuming a linear interpolation between the previous meter reading in July and when I move out, I shall use about 1.75 cubic feet extra on top of today's meter reading. I doubt the utility companies use anything fancier to predict their bills, though they usually err on the side of more consumption. Let's see how far off I'll be.